The fastest way to build trust in a new technology is to show your working. This is where we share the methods, results and thinking behind ADR — openly.
Our white papers set out how ADR works, how we validate it, and what it has delivered in the field. They’re free — we simply ask for your name and email so we can send the download and, if you’d like, keep you posted on new work. Request papers here
- ADR explained: reading the subsurface from the surface — VEXRAD white paper
- Download Virtual boreholes vs drilled outcomes: validating ADR against wireline data
- Download CalcDataMix: the analytical framework behind ADR interpretation
Where our work has appeared in a peer-reviewed journal, we link to the publisher’s version rather than reproduce it — for example, Stove et al. (2013), International Journal of Remote Sensing → Read on the publisher’s site.
For investors & technical due diligence
For deeper technical documentation, programme results and methodology detail, we provide a fuller dossier under NDA. Request the dossier here
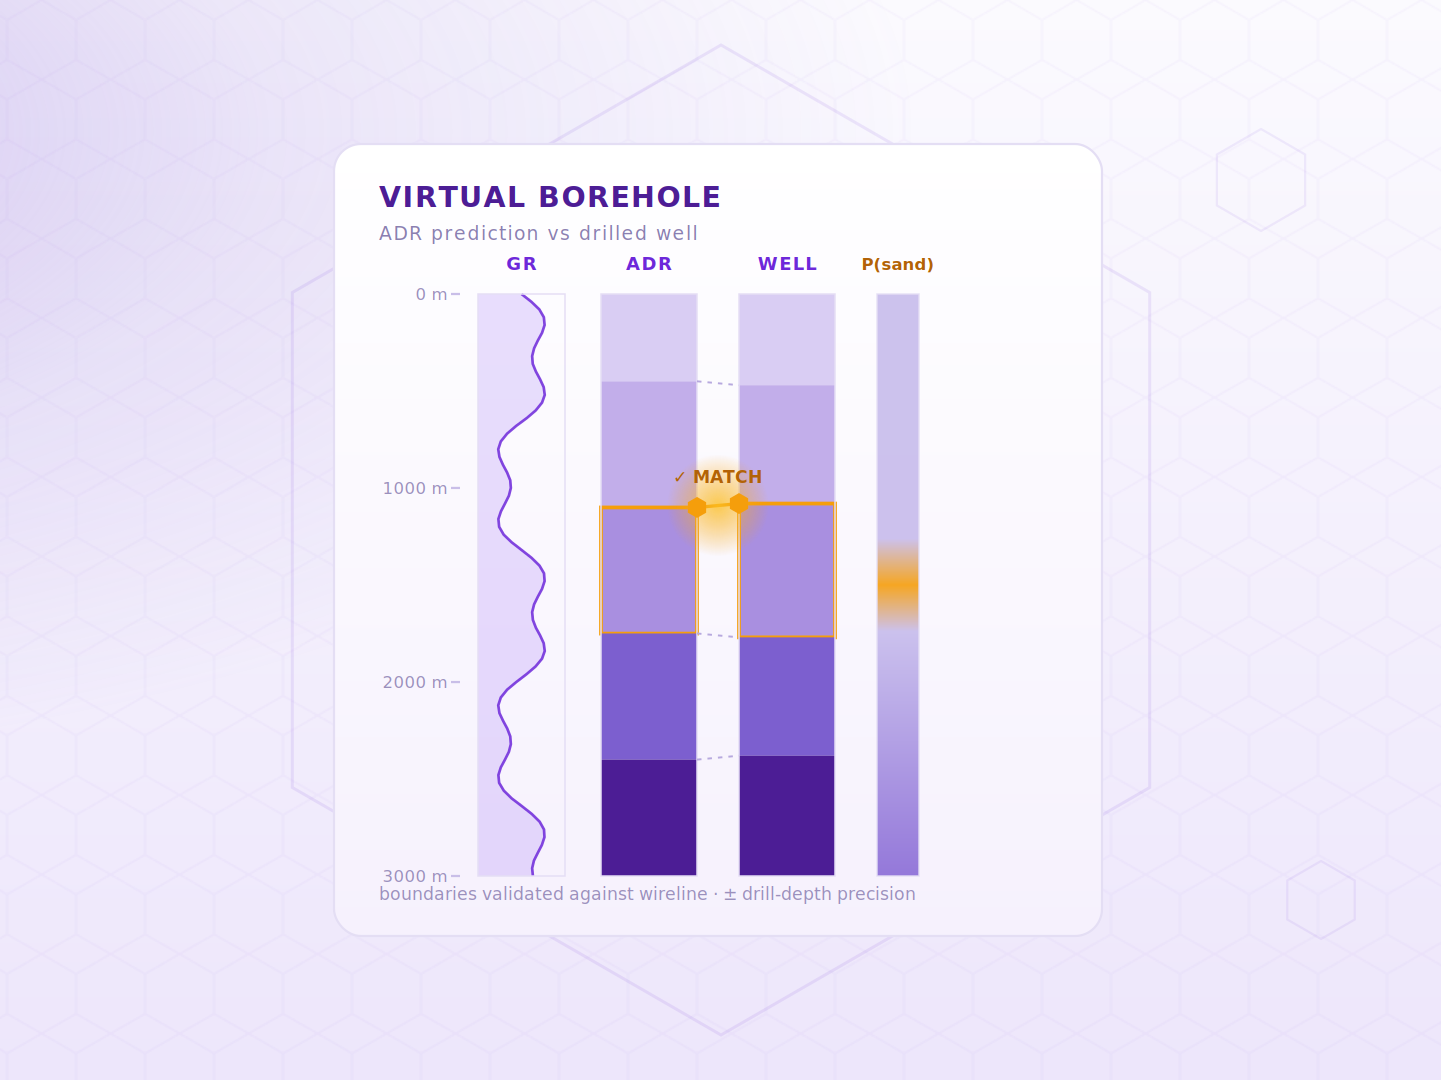
Case Study: Nickel-Copper, Scotland
Every claim we make about ADR is one we’ve tested against the ground. These two case studies show that honestly — including where the method reached its limits.
On a hard-rock nickel–copper project in Scotland, working fully blind, ADR picked lithological contacts at the same depths as the operator’s own drilling and imaged below their existing holes. It also showed, just as plainly, that naming the rock and mineralogy reliably needs a drilled calibration point — the kind of honest limit we’d always rather report than gloss over.
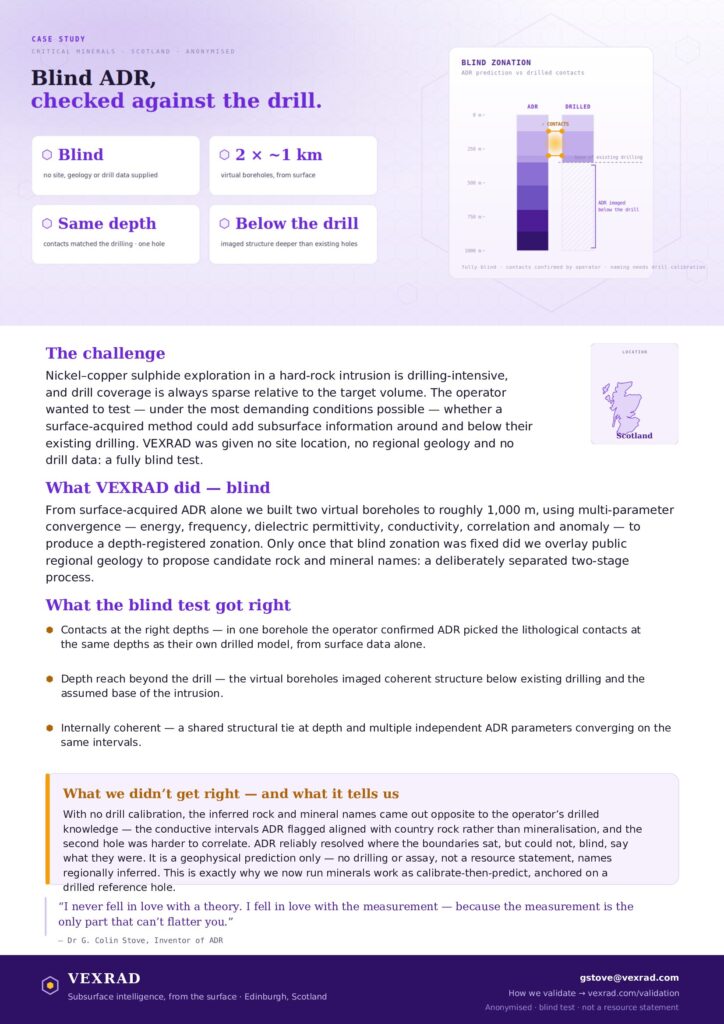
Reading Scotland’s gold-bearing sulphides from surface
Two 2020 Atomic Dielectric Resonance surveys — Gairloch and Lagalochan — testing whether the sulphide systems that carry the gold can be located from surface, and confirmed against the drill.
See before you drill.
In 2020, ADR was tested over two Scottish gold systems that offered something rare — existing drill data to check against. Gairloch, in Wester Ross, is a structurally hosted gold–copper–zinc prospect; Lagalochan, in Argyll, is a copper–gold–molybdenum porphyry whose calibrating core carries 0.11–0.15 g/t gold alongside the copper. Gold in both is carried by sulphide, so ADR was used to read the sulphide system — a pathfinder to the mineralisation, not a grade meter. Calibrated against a known hole at each site, the ADR response separated sulphide-bearing ground from barren (including a correctly reported true negative), reproduced a known shallow zone, and — at both sites — flagged a deeper target below where the drill had reached.
Can sulphide-hosted gold be read from surface?
Sulphide-hosted gold is expensive to chase blind: drilling is slow, costly and destructive, and a grass-roots programme can spend heavily before it learns whether a deeper target even exists. ADR directs stacked, coherent radio-frequency pulses into the ground and reads the returning energy and frequency signature to build a virtual borehole — a depth log acquired from surface, without drilling. These two projects let the interpretation be held up against known geology and grade, the only honest way to prove a remote method. Fieldwork and analysis were carried out under Adrok; the technology and IP are now carried forward and developed by VEXRAD.
Lagalochan is a brecciated, hydrothermally altered felsic intrusive carrying disseminated sulphides, highly variable at the centimetre-to-metre scale. Three scans were sited over drill holes of deliberately decreasing sulphide content — H1 over proven copper in the top 300 m, H2 marginal to the sulphide core, and H3 where drilling found no sulphides in the top 250 m — giving a directly calibrated comparison. Two independent lines of evidence were combined: the relative energy response down each virtual borehole and the 5–10 MHz frequency band, with a background-removal experiment and a 20-point running average to lift the sulphide signal out of noise.
Calibrating drill intercepts
- LD13-1 — 166 m @ 0.18% Cu + 0.13 g/t Au
- LD13-1A — 173 m @ 0.23% Cu + 0.11 g/t Au
- LD13-1A — 19 m @ 0.26% Cu + 0.15 g/t Au
- LD84-13 — 17 m @ 0.07% Cu + 17 ppm Mo
Gairloch had a known shallow mineralised zone from historic drilling, and nothing tested below it — an ideal two-part test: first confirm ADR could find the zone already known, then look deeper than any drill had gone. The scans were interpreted with Weighted Sulphide Correlation Criteria (WSCC), which weights and combines the ADR energy and frequency-harmonic criteria into a single sulphide-likelihood classification down the virtual borehole. WSCC indicates where sulphide is likely to be present; it does not estimate grade.
Assessed against the drill
Every finding is tagged with the evidence tier it earns — confirmed against ground truth, expected from the physics, an untested target, or a true negative.
| Site | Finding | Evidence tier |
|---|---|---|
| Lagalochan | Sulphide-bearing ground separated cleanly from barren — energy strong at H1, moderate at H2, absent at H3; low 5–10 MHz coincided with the high-grade copper–gold core | Validated |
| Lagalochan | In the top 250 m at H3, where drilling found no sulphides, the scan returned no signal — a correctly reported true negative | Known null |
| Lagalochan | Corrected against the running average, H3 showed a response suggesting minor sulphides at ~300 m, below the drilled interval | Candidate |
| Lagalochan | Energy peaks track sulphide presence but with depth scatter (~20 m below peak grade at H1, ~30 m above the projected intercept at H2) | Grounded |
| Gairloch | WSCC placed the known shallow gold–sulphide zone where prior drilling already knew it to be — the necessary first test | Validated |
| Gairloch | Below the depth earlier drilling reached, the scans flagged a further sulphide target at 330–350 m — undrilled | Candidate |
| Gairloch | The calibrated WSCC response extends consistently past the drilled interval, defining the deeper target | Grounded |
Calibrated against the drill, ADR separated sulphide from barren at both sites — and, at both, pointed to a target deeper than the drill had reached.
The team clearly fingerprinted the mineralisation and found a way to identify subsurface sulphide zones from ground level. We’re now in discussions for further test surveys on our other properties.
What this doesn’t claim
- Both were proof-of-concept surveys, and both leaned on prior drilling — the strength of the result comes from that calibration.
- The frequency criteria that worked at Lagalochan are tuned to its uniform felsic host and are not assumed to transfer to different geology unchanged.
- The outputs are sulphide-presence indicators and drill targets — not gold grades, not resource statements.
- Energy-peak depths carried some scatter against the true intercepts.
We report these plainly. That is the point of the four-tier framework.
What the two surveys show together
Given at least one known hole to calibrate on, ADR separated sulphide-bearing ground from barren at both sites — including the true negative at Lagalochan — reproduced the known shallow zone at Gairloch, and then surfaced a candidate target deeper than the existing drill data reached. For a gold explorer, that is the deeper look a surface method is meant to add: calibrate against your ground, then point the drill where it has not yet been.
Talk to us about a survey on your groundCase Study: Geothermal, Denmark
In a deep geothermal programme in Denmark, ADR predicted formation-boundary depths to within a few 10s of metres of the drilled wireline (over 2000m of subsurface depth) and tracked the temperature gradient closely — across six sites, blind-tested against real wells. It’s a clear example of how surface-acquired ADR turns into subsurface intelligence you can plan a drill programme around.
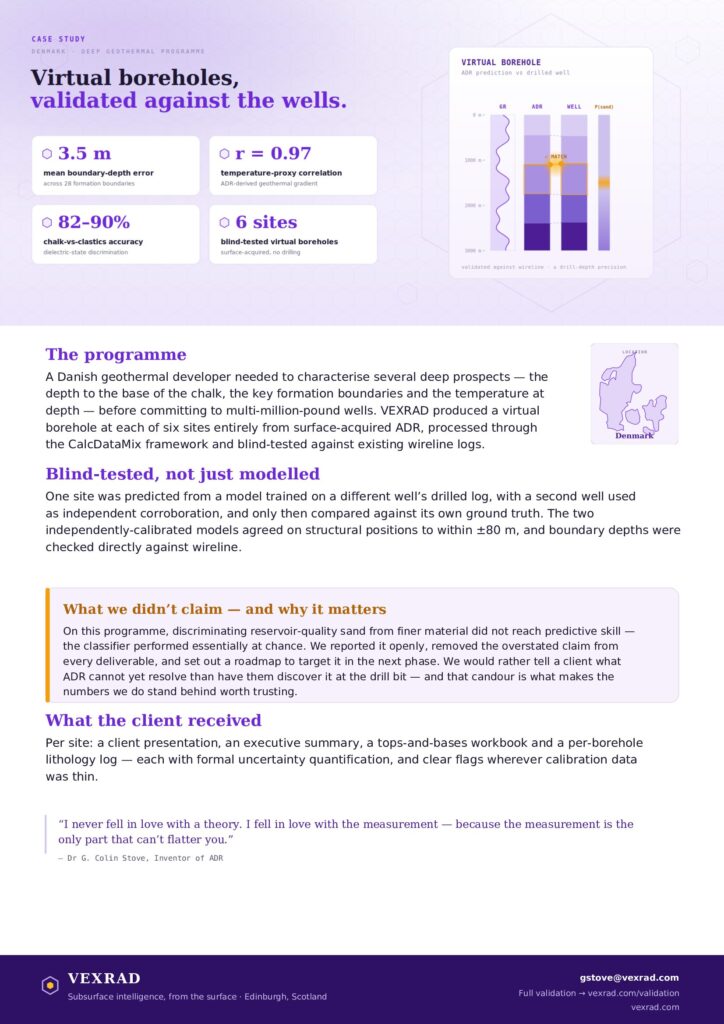
Classifying a 4 km geothermal well from surface — and its reservoir sands
A blind-tested ADR machine-learning lithology model over two deep Copenhagen Basin wells, Denmark — validated against the drill logs.
See before you drill.
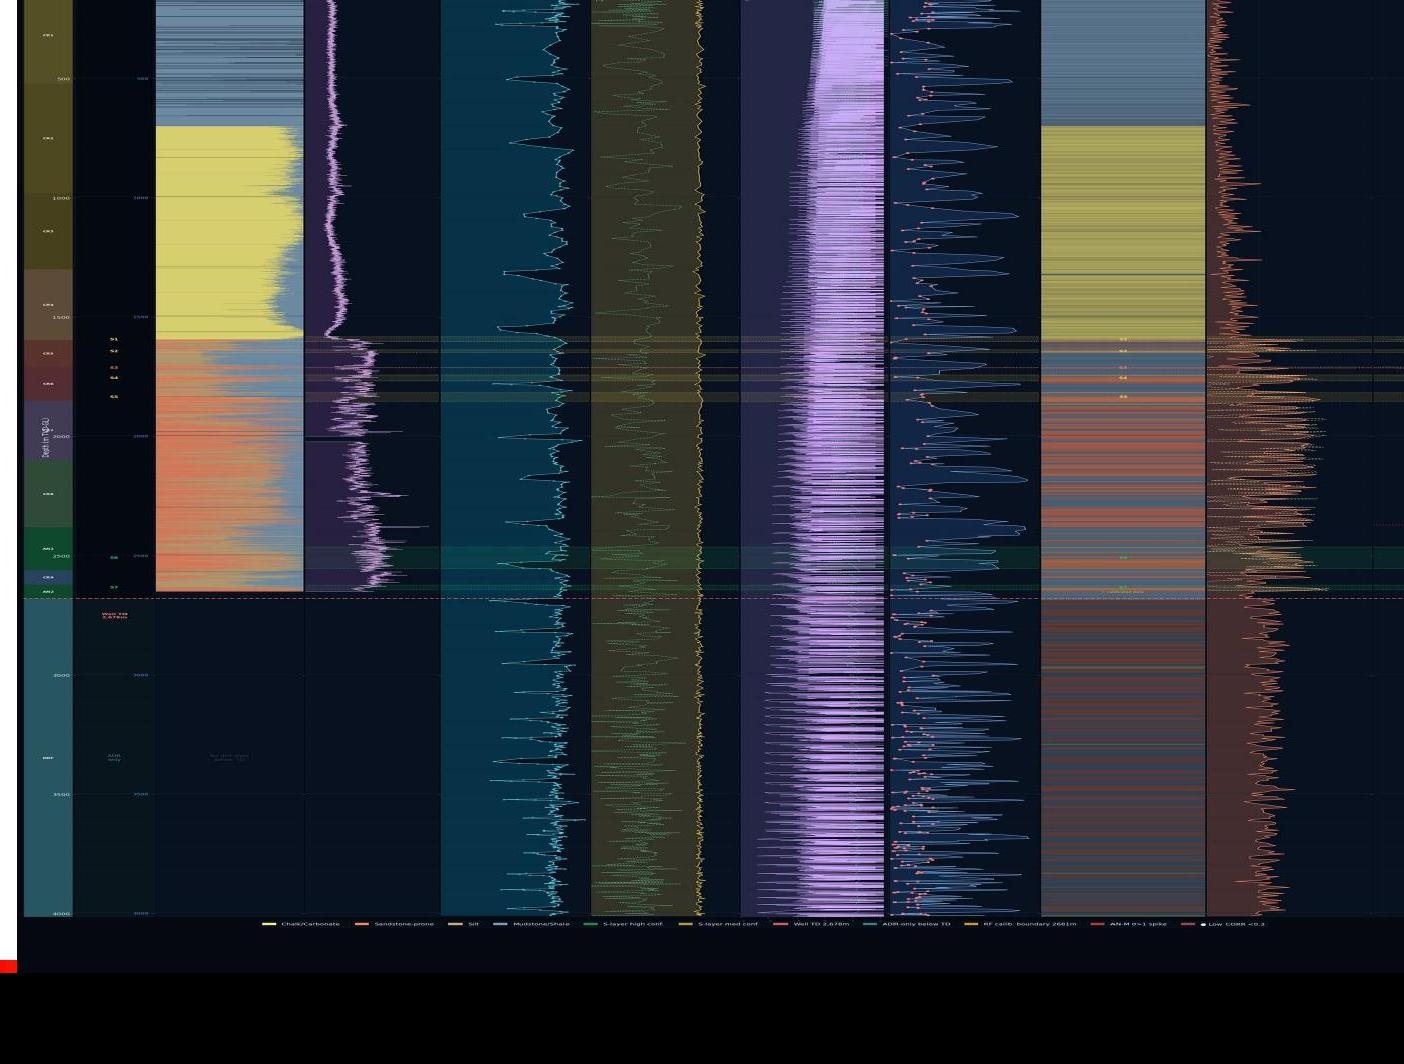
A deep geothermal well lives or dies on its reservoir sandstone: get the depth, thickness and quality of the target sands right, and the well flows; get them wrong, and a multi-million-euro hole disappoints. VEXRAD tested ADR against that question over two deep wells in the Copenhagen Basin, Denmark. From surface, ADR built a ~4 km virtual borehole at each well, and a machine-learning lithology classifier was trained and blind-tested against the wells’ own drill-log interpretation. The result was a genuine validation: in blind cross-validation the ADR sand prediction correlated with actual drill-log sand content at r = 0.89, the model reproduced the full chalk–sand–silt–shale column, and it resolved the target reservoir sands directly — then carried the interpretation more than a kilometre below the deepest log.
A virtual borehole, then a blind test
ADR returns a depth profile — a “virtual borehole” — of the subsurface’s material-property response, acquired from surface. At each of two deep Copenhagen Basin wells, that profile was reduced to a set of ADR parameters (energy, frequency, dielectric response) and fed to a Random-Forest lithology classifier, trained on the well’s log-derived lithology (chalk, sand, silt, shale) and then blind-tested — a 5-fold cross-validation that repeatedly holds out a fifth of the labelled log and predicts it from data the model never saw. That is the honest test of a remote method: not whether it fits the log it learned, but whether it predicts the parts it didn’t.
Against the drill logs
Findings are tagged with the tier they earn — confirmed against the log, expected from the physics, or an untested target.
| Finding | Evidence | Tier |
|---|---|---|
| Full-column lithology | The ADR classifier reproduced the well’s logged chalk–sand–silt–shale column across ~4 km (CV Macro-F1 0.62) | Validated |
| Blind sand prediction | 5-fold cross-validation: 89% sand recall, and the ADR P(Sand) profile correlated with actual drill-log sand content at r = 0.89 | Validated |
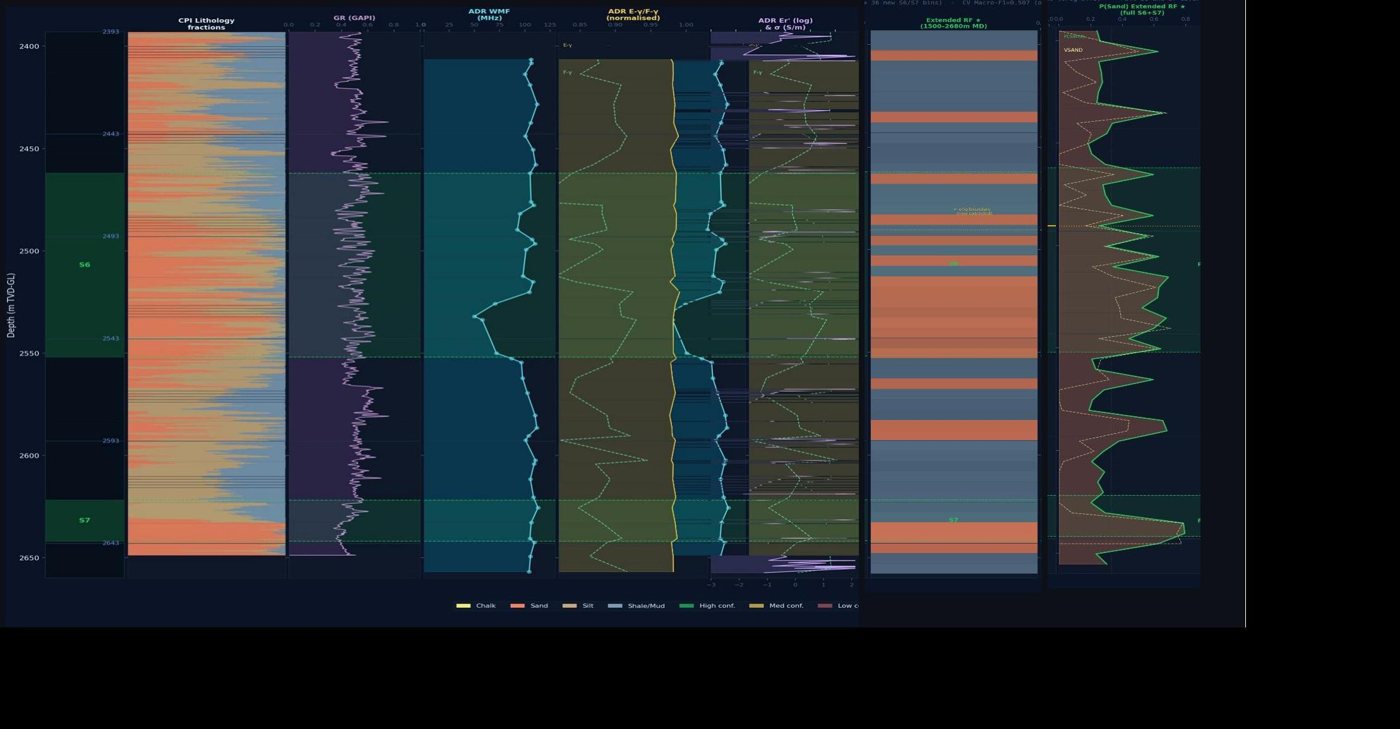
| Reservoir sands (S6 & S7) | Resolved against the logs at ~2,462–2,552 m and ~2,622–2,642 m (VSAND 43–63%) — priority reservoir targets | Validated |
| Beyond total depth | ADR lithology prediction continues ~1,342 m below the deepest log, to ~4,020 m — reconnaissance-level | Grounded |
| Primary anomaly at 2,377 m | A strong ADR event, cross-confirmed at both wells and still undrilled — the programme’s priority new target | Candidate |
The sands that matter
For a geothermal well the reservoir is everything. ADR resolved the two principal target sandstones directly against the well’s lithology log — S6 at roughly 2,462–2,552 m and S7 at roughly 2,622–2,642 m, both with high sand fractions (VSAND 43–63%). These are the intervals a geothermal developer most needs to locate and characterise before committing the well.
What this doesn’t claim
- Validation is against the wells’ log-derived lithology (CPI), not physical core — a strong reference, but an interpretation itself.
- The classifier is probabilistic: several thinner sands were partial matches, including transition beds, and the sand false-alarm rate was around 58%.
- A sub-5 m bed falls below ADR’s ~5 m sampling and was retained as a manual pick, not an independent ADR detection.
- Predictions below the deepest log (to ~4 km) are reconnaissance-level — useful for context, not a substitute for drilling.
We report these plainly. That is the point of the four-tier framework.
What it means for geothermal developers
A deep geothermal well is a large, largely irreversible bet on a reservoir you cannot see. This work shows ADR reading the reservoir sands from surface — their depth, thickness and sand quality — blind-tested against real well logs at two sites, with a strong correlation to actual sand content, and extending the picture below where any log reaches. Calibrated on a well or two in a basin, ADR becomes a low-cost way to de-risk the next target before the rig arrives.
Talk to us about your projectCase Study: Water exploration, Finland
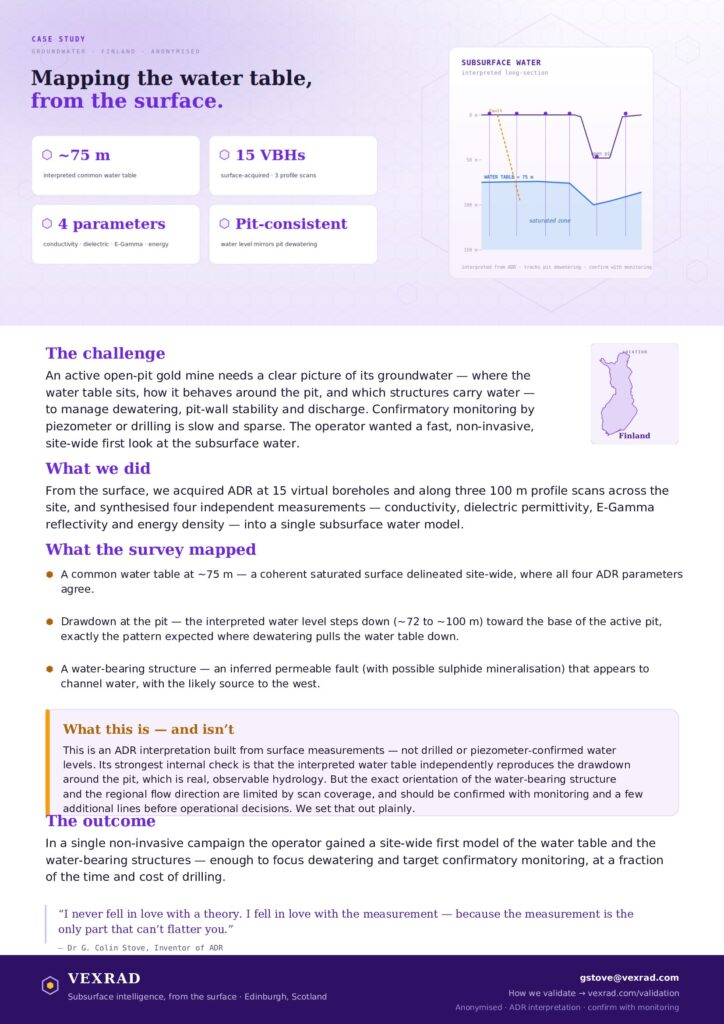
At an active open-pit gold mine in Finland, the operator needed to understand its groundwater — where the water table sits and which structures carry water — to manage dewatering and pit stability. Working entirely from the surface across 15 virtual boreholes, ADR mapped a coherent water table at around 75 metres and traced its step-down toward the pit, matching the drawdown you’d expect from active dewatering — an independent sign the interpretation was tracking real hydrology. It’s a fast, non-invasive first model of the subsurface water, meant to guide where to focus monitoring and drilling rather than replace them.
Mapping groundwater from surface
A 15-borehole subsurface water and dewatering model, built entirely from surface Atomic Dielectric Resonance (ADR) — at an active mine in Finland.
See before you drill.
VEXRAD mapped the subsurface water regime at an active mine in Finland without drilling a single hole. Fifteen ADR virtual boreholes and three 100-metre profile scans, acquired from surface, were combined into a four-parameter model — conductivity, dielectric permittivity, E-Gamma reflectivity and energy density — that resolved a common water table at roughly 75 m, a step-down toward the north pit, a main water-bearing zone, and a fluid classification from freshwater to saline with depth. From that model, a dewatering assessment ranked candidate extraction sites by modelled yield. This is a capability demonstration: the water model is an interpretation from surface geophysics, reported here as such, not a drill-confirmed result.
Four parameters, no drilling
Fifteen virtual boreholes and three 100-metre profile scans were acquired from surface in a single field campaign. ADR returns a depth profile of the subsurface’s material-property response; here four parameters were used together to fingerprint water. Dielectric permittivity rises with water content, conductivity acts as a proxy for fluid type (freshwater, partially saturated, saline), E-Gamma marks layer boundaries and faults, and energy density tracks the combined response.
A water table, from surface
Combined across the four parameters, the survey delineated a coherent water-bearing zone and a common water table. The main zone sits toward the north of the survey; the interpreted water table lies at roughly 75 m and steps down from about 72 m to about 100 m toward the north pit.


Every finding below is an interpretation from surface ADR. Under VEXRAD’s four-tier standard these sit at Candidate — real, coincident signals across parameters, but not yet confirmed by drilling.
| Feature ADR mapped | Indication | Evidence tier |
|---|---|---|
| Common water table | ~75 m depth across the site, from a shared change in multiple parameters | Candidate |
| Water-table step-down | From ~72 m to ~100 m toward the north pit | Candidate |
| Main water-bearing zone | North of the survey — coincident conductivity and dielectric highs | Candidate |
| Fluid zonation | Freshwater near surface → partially saturated → saline with depth | Candidate |
| Dewatering candidates | Highest modelled yields at three sites (Darcy Q = K·i·A) | Candidate |
From water model to well placement
Classifying each depth by conductivity showed the section grow more saline with depth — freshwater near surface, mixed and then saline below. A dewatering assessment then estimated yields with a Darcy approximation (Q = K·i·A), ranking candidate extraction sites and depths against geological risk read from the E-Gamma response.

What this doesn’t claim
- This is a capability study, not a validation: there is no independent drill ground-truth here, so the water model is an interpretation, not a confirmed result.
- The water table is inferred from a common change in values across datasets; the flow-direction interpretation is explicitly tentative, given the limited spread of scans.
- Dewatering yields are order-of-magnitude Darcy approximations — useful for ranking sites, not a substitute for a pumping test.
We report these plainly. A result is only worth as much as the honesty around it.
What it means for mine operators
For a working mine, water is both an asset and a hazard, and drilling to find it is slow and costly. This survey shows ADR building a whole-site water and dewatering picture from surface, non-invasively, in a single campaign — enough to rank where to drill, dewater or manage water before committing to a rig. On a live project the picture sharpens further: calibrate ADR against one or two of the operator’s existing holes, and the interpreted model becomes a validated one.
Talk to us about your projectCase Study: United Downs — geothermal, Cornwall
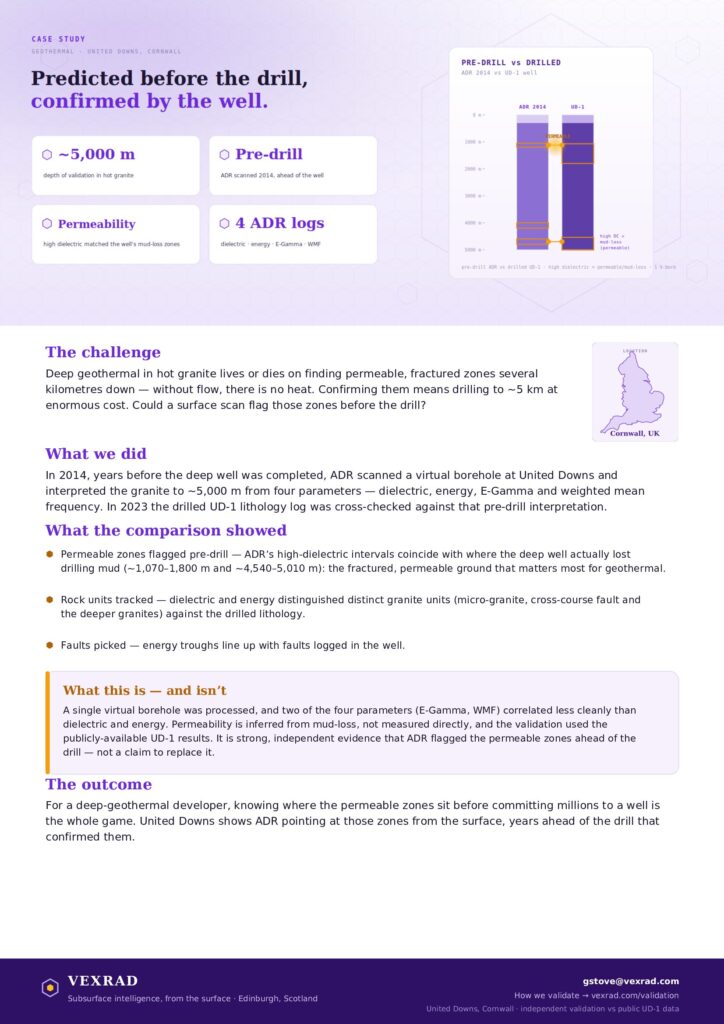
Deep geothermal in hot granite comes down to one question: are there permeable, fractured zones kilometres down where hot water can actually flow? At the United Downs project in Cornwall, ADR scanned a virtual borehole to around 5,000 metres in 2014 — years before the deep well was finished — and flagged the zones of interest from the surface. When the drilled well’s log was compared against that prediction in 2023, ADR’s high-dielectric zones lined up with where the well had actually lost circulation: the permeable ground that matters most. It’s an independent validation against public well data — evidence that ADR pointed at the flow zones ahead of the drill, not a replacement for it.
United Downs, Cornwall: a pre-drill prediction, tested by a 5 km well
Independent validation of Atomic Dielectric Resonance (ADR) against public data from the UK’s flagship deep-geothermal well.
See before you drill.
In November 2014, ADR produced a blind, pre-drill virtual borehole at the United Downs Deep Geothermal project in Cornwall — years before the UD-1 well reached depth. When the completed well was later cross-checked against the 2014 prediction, using publicly available UD-1 data, ADR’s predicted permeable zones fell within the intervals where the well went on to record its major mud losses — the field signature of permeability, and the single most important property for a geothermal well. The strongest energy troughs aligned with mapped faults, and the dielectric response tracked the distinct granite units the drill later encountered. This is a genuine “see before you drill” result, reported here with its limits as well as its wins.
A rare deep target with a public answer
United Downs, near Redruth, is the UK’s flagship deep-geothermal development. Its UD-1 well was drilled to around 5 km into hot Cornish granite to test permeability along a major fault structure — one of the most demanding onshore targets in the country, and a rare case where a deep, well-documented public dataset exists to test a prediction against.
What ADR did
ADR measures the dielectric response of the subsurface to a coherent pulsed electromagnetic signal, returning a depth profile — a “virtual borehole” — of material-property contrasts. At United Downs the virtual borehole UD-C2 was acquired in November 2014 and reported in 2015, entirely ahead of drilling. From the dielectric and energy responses it flagged three candidate permeable zones — at approximately 1,100 m, 4,100 m and 4,700 m. No drilling data existed at the time to guide it.

Assessed against the drilled well
Each finding is reported under VEXRAD’s four-tier evidence standard — nothing is claimed beyond what the data supports.

| Depth / feature | ADR pre-drill prediction (2014) | UD-1 well outcome | Read |
|---|---|---|---|
| ~1,070–1,800 m | High dielectric; permeable-zone pick ~1,100 m | Major mud losses (permeability) | Validated |
| ~4,540–5,010 m | High dielectric; permeable-zone pick ~4,700 m | Major mud losses (permeability) | Validated |
| ~4,100 m | Additional permeable-zone pick | Not separately confirmed | Candidate |
| Faults | Strongest energy-response troughs | Align with mapped UD-1 faults | Validated |
| Granite units | High dielectric zones | Track micro-granite, cross-course fault, Granite A & D | Validated |
Two of ADR’s three blind permeable-zone picks — made in 2014 — fall inside the intervals where UD-1 later recorded its major mud losses. For a geothermal well, permeability is the prize, and ADR flagged it ahead of the bit.
What this doesn’t claim
- Only one virtual borehole (UD-C2) was processed for this validation.
- The dielectric and energy parameters correlated well; the WMF and E-Gamma parameters did not, and the E-Gamma processing window differs from VEXRAD’s standard temperature setting.
- Permeability was inferred from the well’s mud-loss record — a robust field proxy, but not a direct measurement.
We report these plainly. A validated result is only worth as much as the honesty around it.
What it means for explorers and developers
United Downs shows ADR doing the one thing that most de-risks a deep well: flagging where permeability is likely, before the drill gets there. On a live project the method is sharper still — calibrated against one or two of your own logged holes first, then used to predict where, and where not, to drill.
Talk to us about your projectCase Study: Lithium — pre/post-drill, NE England
Lithium from geothermal brine depends on granite-hosted, fractured rock — and a developer in NE England wanted to know how much a surface ADR interpretation could tell them before drilling, and how much sharper it got afterwards. Running the same two boreholes both before and after the drill, the answer was honest and useful: the temperature-proxy picks ADR made blind held up against the drill unchanged, while the finer lithology only sharpened once a calibration hole anchored it — pinning the top of the granite and resolving individual quartz veins. It’s the clearest illustration of why we now work calibrate-then-predict: one drilled hole turns a rough zonation into a sharp one.
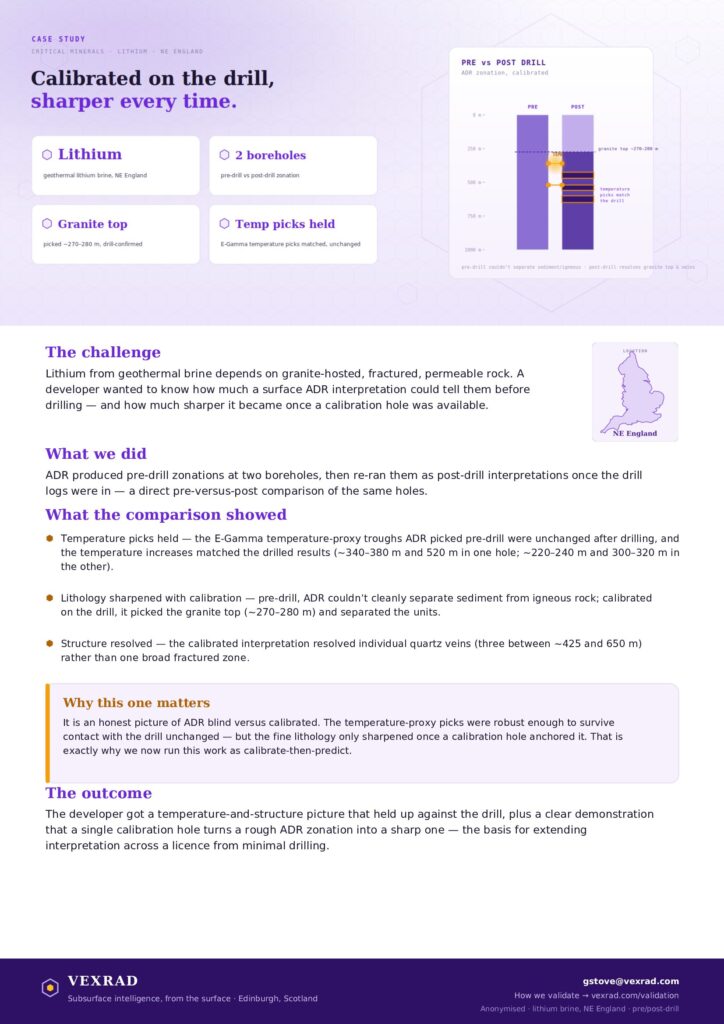
Calibrate, then predict
How a single calibration against the drill turned a blind ADR log into a resolved lithology and temperature model — at a geothermal lithium-brine project in northeast England.
See before you drill.
VEXRAD interpreted deep ADR virtual boreholes at a geothermal lithium-brine project in northeast England twice over — once blind, before drilling, and once calibrated against the drill. The comparison is the clearest demonstration of why VEXRAD works calibrate-then-predict. Blind, ADR resolved the subsurface zonation and, critically, the temperature-proxy troughs — but could not cleanly separate sedimentary from igneous rock. Calibrated against the drill, ADR resolved the full lithology: the top of the granite, the sediment–igneous boundaries, and individual quartz veins. And the one thing calibration did not change — the temperature picks — matched the drilled temperature increases both times.
Interpret twice — blind, then calibrated
Two deep boreholes (coded LF03a and LF10) were each interpreted in two passes. The pre-drill pass used ADR alone, with no drilling to guide it. The post-drill pass calibrated the same ADR data against the completed drill log. Comparing the two shows precisely what ADR resolves on its own, and what a calibration step adds.
What the drill added
Findings are reported under VEXRAD’s four-tier standard — confirmed against the drill.


| Feature | Blind pre-drill ADR | After calibration to the drill | Read |
|---|---|---|---|
| Temperature increases | Troughs picked at 340–380 m & 520 m (LF03a); 220–240 m & 300–320 m (LF10) | Unchanged — and matched the drilled temperatures | Validated |
| Start of granite | Not clearly resolved | ~280 m (LF03a) / ~270 m (LF10) | Validated |
| Sediment vs igneous | Could not be separated | Cleanly differentiated | Validated |
| Quartz veins | Read as a broad fractured-granite zone | Three veins resolved, 425–650 m (LF10) | Validated |
The temperature model was right blind; the lithology model needed the drill. Calibrate once, and ADR predicts the rest — that is calibrate-then-predict.
What this doesn’t claim
- This was a focused two-borehole study, not a field-wide model.
- The lithological refinement depends on calibration; blind ADR here resolved structure and temperature, not rock names.
- Validation is against the operator’s drill logs; the correlations are strong but interpretive.
We report these plainly. A result is only worth as much as the honesty around it.
What it means for developers
This is the clearest picture of how VEXRAD delivers value on a live project. Calibrate ADR against one or two of your logged holes, and it will then predict lithology, temperature and structure into the un-drilled ground — at a fraction of the cost of drilling to find out. For a geothermal or lithium-brine developer, where temperature and permeability decide the project, that is a read worth having before the rig moves.
Talk to us about your projectCase Study: Lead–zinc sulphides — proof of concept, USA
Finding massive lead–zinc sulphides means drilling into a large rock volume for sparse hits, so a major base-metals miner set ADR a hard test: identify the sulphides from the surface, at a mine where they’re already known. ADR’s sulphide-targeting score lit up over the known massive sulphides at around 500–550 metres, stayed low where the drill logs show none, and agreed between surface and underground vantage points. Framed honestly as a pre-drill targeting filter rather than a resource statement, it’s exactly the kind of surface method that concentrates drilling where it pays.
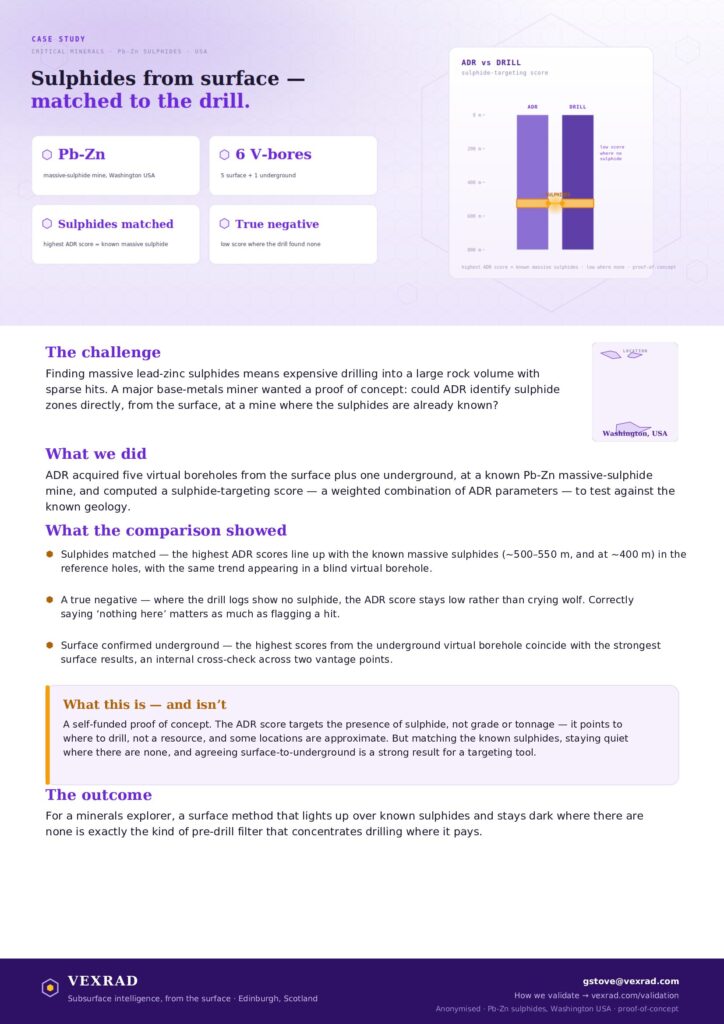
Finding lead–zinc sulphides from surface
A self-funded blind test of Atomic Dielectric Resonance (ADR) over a carbonate-hosted Zn–Pb sulphide system — with a true positive and a true negative.
See before you drill.
VEXRAD ran a self-funded proof of concept to test whether ADR could identify lead–zinc massive sulphide directly from surface, over a carbonate-hosted Zn–Pb system worked by a major base-metals producer in the northwestern United States. Six virtual boreholes — five from surface and one underground — were interpreted using a Weighted Sulphide Correlation Criterion (WSCC) and then checked against the operator’s drill logs. The result did the two things a sceptical geologist most wants to see: where the drill hit massive sulphide, WSCC flagged it (a true positive); where the drill found none, WSCC stayed low (a true negative). An independent underground scan then corroborated the surface highs.
Detect sulphide from ground level, blind
The aim was deliberately hard: identify subsurface sulphide zones from ground level, with no reliance on drilling to guide the interpretation. ADR returns a depth profile — a “virtual borehole” — of the subsurface’s material-property response. The WSCC method weights several ADR parameters into a single index tuned to the signature of massive sulphide, so a high WSCC reading is a candidate sulphide zone. Five surface virtual boreholes and one underground virtual borehole were acquired and interpreted, then compared with the operator’s logged holes.
Assessed against the drill logs
Each finding is reported under VEXRAD’s four-tier evidence standard — nothing is claimed beyond what the drilling supports.

| Hole / feature | ADR (WSCC) result | Drill-log ground truth | Read |
|---|---|---|---|
| MX03, ~500–550 m | Highest WSCC in the survey | Massive sulphide | Validated — true positive |
| MX03 & MX19, ~400 m | WSCC peak in both boreholes | Massive sulphide | Validated |
| MXP1 (blind V-bore) | Same WSCC trend, interpreted blind | Consistent with adjacent holes | Candidate |
| MX73 | Low WSCC (minor peak ties to a ~200 m dike) | No sulphide logged | Validated — true negative |
| Underground V-bore | Highest WSCC values | Coincide with the surface-validated highs | Validated — cross-check |

ADR flagged sulphide where it was present and stayed quiet where it was absent. A true positive proves detection; a true negative proves discrimination — the harder, more valuable half of the test.
What this doesn’t claim
- This was a proof of concept, not a resource study; WSCC flags the presence of sulphide, not its grade or tonnage.
- Validation is against the operator’s drill logs; the correlations are strong but interpretive.
- The underground virtual borehole’s exact scan location was not recorded and had to be approximated, so its cross-check is indicative rather than precise.
We report these plainly. A result is only worth as much as the honesty around it.
What it means for explorers
For a massive-sulphide explorer, the expensive risk is drilling barren ground. This test shows ADR reading sulphide presence from surface, blind — hitting where the drill hit and, just as importantly, staying low where it didn’t. On a live project the method is sharper still: calibrated against one or two of your logged holes first, then used to rank targets before you commit to diamond drilling.
Talk to us about your projectInsights & Evidence
Australia Gold
Locating narrow-vein gold lodes from surface, beneath a town, where nine other geophysical methods had failed.
Two lodes, located to within a metre, at 700 metres depth
This is a virtual borehole: relative returned energy plotted against depth, acquired from the surface without breaking ground. A sharp leftward spike marks a strong dielectric contrast — the boundary between massive sulphide and its granite host.
Scan A63 put its two lowest values at 664.77 m and 695.15 m. Drilling found gold at 664 m and 696 m.
The challenge
Charters Towers has produced over 7 million ounces of gold since 1872, most of it before 1917. It remains highly prospective. It is also close to untargetable.
The gold sits in pods and lenses of massive sulphide — galena, pyrite, sphalerite — inside quartz veins typically under a metre thick and under 50 m in their longest dimension, at depths past 400 m. Grade varies at the metre scale: the same reef yields 0.5 m at 0.1 g/t Au in one place and 0.3 m at 30 g/t Au a few metres along. And the primary target area lies directly beneath a country town, which rules out most surface geophysics on access grounds before physics even enters the argument.
The operator had tested the field methodically: borehole radar, surface magnetics, radiometrics and gravity, borehole induction and gamma, DHIP, surface and borehole TEM, DCIP, regional MT and government-funded deep seismic. None defined a drillable target. Down-hole IP returned a 52% anti-correlation between its predicted mineralised zones and the mineralisation actually present in core — marginally worse than drilling at random.
What we did
Atomic Dielectric Resonance transmits a coherent, low-power pulsed electromagnetic beam from the surface — 1 to 70 MHz for deep mineral work — and analyses the returned energy, frequency and phase spectra to build a virtual borehole: a vertical log of dielectric contrast with depth, acquired without breaking ground.
The team was given one drill core to calibrate against. No information on the location of sulphides was supplied. Several scans, A56 among them, were shot over ground where the operator’s own geologists had no knowledge of mineralisation and where drilling was scheduled to begin only after the survey was delivered.
Over two weeks the crew averaged eight scans a day and completed more than eighty — a vertical sampling extent equivalent to roughly 80,000 m of drilling, or about 2,300 rig-days with a single diamond rig. Nine processed scans across the Warrior, Imperial and Central areas are reported here.

Results
| Scan | Area | ADR pick | Ground truth | Difference |
|---|---|---|---|---|
| A09 | Warrior | 182.06 m | CT772 high Pb/Au intercept, 175.2–175.35 m | +7 m |
| A84 | Warrior | 381.55 m | E03 expected 375 m; CT3067 0.9 m @ 20.4 g/t Au | +6.5 m |
| A62 | Warrior | 344.29 m | E03 anticipated intercept 335 m | +9 m |
| A56 | Imperial | 467.91 m | CT8205 ~40 cm intercept, 37.9 g/t Au, 7,200 ppm Pb | <2 m |
| A30 | Imperial | 510 m / 608.9 m | CT8204: E07 hanging wall 514.27 m; new footwall 589.5 m | ~9 m |
| A63 | Central | 664.77 m / 695.15 m | 664 m @ 183 g/t Au; 696 m @ 15.8 g/t Au | +0.8 / −0.9 m |
| A50 | Central | 708.48 m | Brilliant reef projected at 720 m | ~12 m |
| A22 | Imperial | 616 m | Along strike of E07 — undrilled | — |
Scan A63 · Central · 664.77 m / 695.15 mTwo lodes to within a metre, under the town
The Central area sits under the town itself, where land access forecloses almost every alternative. Its two lowest energy values fell at 664.77 m and 695.15 m. The DD93_QF5 drill series intersected mineralisation at 664 m, assaying 183 g/t Au and 12,700 ppm Pb, and at 696 m, assaying 15.8 g/t Au and 8,150 ppm Pb. The picks are out by 0.8 m and 0.9 m.

Scan A56 · Imperial · 467.91 mA prediction made before the hole existed
A56 returned a single anomaly at 467.91 m. Diamond hole CT8205 was collared 75 m away and drilled to test it. It cut a roughly 40 cm intercept at 463 m down hole, assaying 37.9 g/t Au and 7,200 ppm Pb. Measured against the projected E07 structure surface rather than the down-hole depth, the difference between the ADR pick and the expected intersection is under 2 m.

Scan A30 · Imperial · 510 m / 608.9 mA structure that was not on the map
A30 returned anomalies at 510 m and 608.9 m against modelled expectations of 501 m and 600 m. Hole CT8204 was drilled afterwards as part of the operator’s resource expansion. It intersected the E07 hanging wall at 514.27 m — and a second, previously unknown E07 footwall structure at 589.5 m. The geometry of E07 at that location had been poorly constrained until the hole was completed.

The comparison that matters most
After CT8205 was drilled it was cased with PVC and logged with down-hole magnetic susceptibility and conductivity, scanned twice at 5 cm intervals with a Mount Sopris tool.
Neither log identified the sulphides. The magnetic lows and conductivity anomalies picked out variations in rock type — mafic dykes in particular — but not the ore.
ADR had located that intercept from the surface, before the hole existed.

Why it works here
ADR does not detect gold. It detects dielectric contrast — and at Charters Towers the contrast is exceptional. CSIRO measured it directly on site material.
Dielectric constant at 1 MHz. Granite is a three-sample average; pyrite ore, one sample. Measured by CSIRO.
An order of magnitude, between a pod of massive sulphide and a granite host that is otherwise close to homogeneous. That is the whole mechanism. Where gold sits in sulphide pods or vein systems, ADR reaches it by proxy. Where it is disseminated with no dielectric contrast, ADR does not.
The trial’s own conclusion was that no false anomalies were recorded across the scans tested: in every case, the significant energy anomaly corresponded with sulphides, and the remainder of each scan carried no anomalous response. Two picks remain untested — A22 at 616 m, along strike of E07 beyond the limit of drilling, and A50’s shallower anomaly at 220.5 m, which sits beneath the central park in town.
What this result does not show
We publish the boundaries because they are what make the numbers above worth reading.
- ADR does not assay. It returns depth, structure and material class, not grade. Every target still needs a hole.
- Depth errors are real. The spread across these nine scans ran from under a metre to about 12 m. Sub-metre accuracy is the best case, not the expectation.
- This was close to a best-case deposit. Massive sulphide pods in a near-homogeneous granite host is the strongest dielectric contrast in our record. A disseminated system in a heterogeneous host is a different proposition.
- Calibration mattered. One local core was enough here, but ADR is at its most accurate where nearby drill control exists to train against.
Where ADR fits your programme
Not as a replacement for drilling — as the step before it. A virtual borehole is acquired in a day, from the surface, at a fraction of the cost of the hole it informs.
Brownfield extension
Where mine geology and assays exist to calibrate on, ADR is at its most accurate. This is the Charters Towers configuration.
Ranking drill targets
Train on the holes you have, scan the untested ground, drill the anomalies first.
Access-constrained ground
Under towns, in jungle, on protected or remote terrain where rigs and conventional geophysics cannot practically go.
See before you drill.
A gold programme starts with a short feasibility review of your existing drill control and deposit style, to establish whether the dielectric contrast at your project supports the method — before any field mobilisation is proposed.
gstove@vexrad.com · +44 (0)7939 051 829